Make graphs: pmacct and Cacti

Pedro Sanchez (name.v.surname @ gmail.com)
|
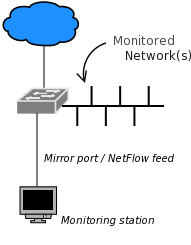
Status of this paper This is a first draft about the topic. I'm starting to write this paper on 09-Feb-2005 and it should be released in next couple of days. Don't hesitate to contact me for suggestions, ideas and indeed errors. I'll keep this document as current as possible. Introduction Cacti is a complete network graphing solution designed to harness the power of RRDTool's data storage and graphing functionality. This short paper will guide you in the few and easy steps needed to make pmacct and Cacti work together to produce nice graphs. While it is based over pmacctd, the pmacct libpcap-based daemon, it will work without troubles even if used with nfacctd, the pmacct NetFlow-based daemon. If you are just curious about the final effect, go straight to the end of the page. At right, a draft of the environment described in this document. Requirements Because RRDtool is already an efficient storage for our data, we will use the In-Memory Table (IMT) plugin on pmacct side (as a temporary storage) rather than a SQL database. Because we are using pmacctd, the unique dependency to satisfy is the following: On Cacti side (took from Cacti's README) the dependencies to satisfy are the following: |
 |
Configuration: pmacct
We here assume that software dependencies are satisfied. pmacct and Cacti have been downloaded,
compiled and installed successfully. Try to not forget about anything (have you inserted the
Cacti's poller.php in your crontab, heh ?). If you encounter problem at this stage, please
refer to both software documentation for troubleshooting.
Because pmacct feeds data to Cacti, let's start from pmacct. The goal is to account traffic
by network (but changing "src_net" with "src_host" and "dst_net" with "dst_host" you will be
able to account traffic on a host basis). We will fire pmacctd with two plugins, named in
and out: this way we will have incoming and outcoming traffic breakdowns. We will also
need to define our local networks and enable buffering to deal with sustained traffic rates
(i've read about this point in FAQS).
Below are listed pmacctd.conf, the pmacctd configuration file, and networks.def,
the networks definition file.
pedro@abuelo:~> cat /usr/local/etc/pmacctd.conf
!
! pmacct: In + Out
!
debug: false
daemonize: true
interface: eth0
plugin_buffer_size: 2048
plugin_pipe_size: 2048000
networks_file: /usr/local/etc/networks.def
plugins: memory[in], memory[out]
aggregate[in]: dst_net
aggregate[out]: src_net
imt_path[in]: /tmp/in.pipe
imt_path[out]: /tmp/out.pipe
pedro@abuelo:~> cat /usr/local/etc/networks.def
!
! local networks
!
192.168.100.0/24
192.168.101.0/24
192.168.102.0/24
192.168.103.0/24
192.168.104.0/24
192.168.105.0/24
192.168.106.0/24
192.168.107.0/24
192.168.108.0/24
Armed with superuser power, launch the daemon: pmacctd -f /usr/local/etc/pmacctd.conf
Check: pmacct (Optional)
To check that pmacctd is working correctly try some query to both plugins. If you have bounded it to an active interface, you should be able to see your traffic. Note that because we have enabled buffering (plugin_buffer_size/plugin_pipe_size) if you are monitoring a test interface (which translates in poor traffic) it may take some seconds before you will be able to see it logged. Two queries to test that everything is working correctly:
Configuration: Cacti
Cacti is fully graphical software, hence we will describe the following steps in terms of clicks
and fields to be filled. All the following configuration steps are in the Cacti's Console menu.
Data Input Methods, Add
Once created, you will be able to see it in the list. Click over Get pmacct data, then go for Input Fields, Add:
Now, go for Output Fields, Add:
Now, Data Templates, Add:
Once created, you will be able to see it in the list. Click over pmacct Data Template:
Now, Graph Templates, Add:
Once created, you will be able to see it in the list. Click over pmacct Graph:
Add a new Graph Template Item:
Add a new Graph Template Item:
Add a new Graph Template Item:
Add a new Graph Template Item:
Add a new Graph Item Input:
Add a new Graph Item Input:
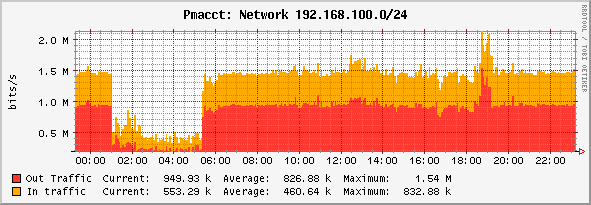
Go to Data Sources. In this menu you will need to setup queries to pmacct for all local networks you need graphs. It's very likely that you will iterate more times through the following steps. For brevity, I will show what i've done for my 192.168.100.0/24 network. Add:
Add, again:
Once you are finished with queries setup, go finally to Graphic Management. Here, pmacct queries will be bound to real graphics. This is because, it's likely that you will need to iterate more times through this final step. Add:
And here we are finished ! Now take a coffee and get to the screen in ten minutes. Going to the Graphs section you should be able to see the first lines coming on. We have just configured a graph that will resemble the following figure in the next 24 hours: